> ## Documentation Index
> Fetch the complete documentation index at: https://docs.abbyy.com/llms.txt
> Use this file to discover all available pages before exploring further.

# ファジー区間ビジュアルエディタ

> ABBYY FlexiLayout Studio の あいまい区間エディタ を使用して、傾き、極値点、非減点点を調整しながらファジー区間をグラフィカルに指定します。

ABBYY FlexiLayout Studio には、ファジー区間を簡単に指定できるビジュアルエディタが用意されています。

あいまい区間エディタは、次の 2 つの方法のいずれかで開くことができます。

* **Character String** 要素の **Properties** ダイアログから: **Character String** タブで、<img src="https://mintcdn.com/abbyy/fmgRWFNHKYN2MLSg/images/flexi-capture/fls/Button_points.gif?s=494881c954b44aa8b446880d31ab4d12" alt="参照ボタン" style={{display:"inline-block",verticalAlign:"middle",margin:0}} width="19" height="18" data-path="images/flexi-capture/fls/Button_points.gif" /> ボタンをクリックします。
* メインメニューから **Tools → あいまい区間エディタ…** を選択します。
<Frame>
  <img src="https://mintcdn.com/abbyy/lqYknuOmCa79141v/images/flexi-capture/fls/fuzzy_int.gif?fit=max&auto=format&n=lqYknuOmCa79141v&q=85&s=885ec635b5e7a663b94d6e096ca57538" alt="ABBYY FlexiLayout Studio のあいまい区間エディタのスクリーンショット。品質軸、ズームおよび移動のコントロール、left、right、非減点点の数値 field を含む区間グラフが表示されています。" width="621" height="590" data-path="images/flexi-capture/fls/fuzzy_int.gif" />
</Frame>

<div id="graph-axes-and-coordinates">
  ## グラフの軸と座標
</div>

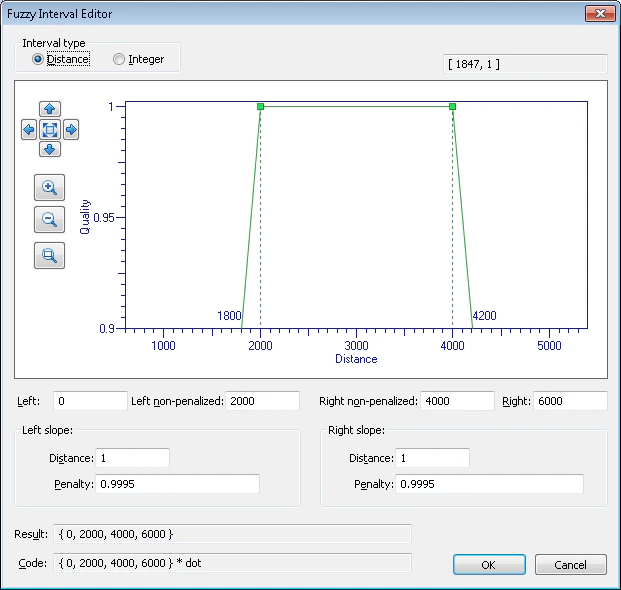
**あいまい区間エディタ** には、ファジー区間がグラフ形式で表示されます。縦軸は仮説の品質を、横軸は線形寸法または文字数を表します。ファジー区間の境界線が横軸と交わる点の座標もグラフ上に表示されます。

<div id="zoom-and-pan-the-graph">
  ## グラフの拡大/縮小と移動
</div>

"Zoom in" ボタンと "Zoom out" ボタンでは、横方向と縦方向の縮尺が同期して変更されます。また、**Zoom selected area** ボタンを使用して、選択した画像領域を拡大することもできます。<img src="https://mintcdn.com/abbyy/lqYknuOmCa79141v/images/flexi-capture/fls/int_right.gif?fit=max&auto=format&n=lqYknuOmCa79141v&q=85&s=22e9893e605ecc95a343ded44033b040" alt="右へ移動ボタン" style={{display:"inline-block",verticalAlign:"middle",margin:0}} width="16" height="21" data-path="images/flexi-capture/fls/int_right.gif" /> <img src="https://mintcdn.com/abbyy/lqYknuOmCa79141v/images/flexi-capture/fls/int_left.gif?fit=max&auto=format&n=lqYknuOmCa79141v&q=85&s=3205b441eb3265d075687ce5d55130ee" alt="左へ移動ボタン" style={{display:"inline-block",verticalAlign:"middle",margin:0}} width="16" height="21" data-path="images/flexi-capture/fls/int_left.gif" /> <img src="https://mintcdn.com/abbyy/r-nfa7jujx5b9gKX/images/flexi-capture/fls/int_up.gif?fit=max&auto=format&n=r-nfa7jujx5b9gKX&q=85&s=5042229896ef2b4bc1daddbca90a1481" alt="上へ移動ボタン" style={{display:"inline-block",verticalAlign:"middle",margin:0}} width="22" height="16" data-path="images/flexi-capture/fls/int_up.gif" /> <img src="https://mintcdn.com/abbyy/lqYknuOmCa79141v/images/flexi-capture/fls/int_down.gif?fit=max&auto=format&n=lqYknuOmCa79141v&q=85&s=484a20da38daa3bc6b1b2be146509e0e" alt="下へ移動ボタン" style={{display:"inline-block",verticalAlign:"middle",margin:0}} width="22" height="16" data-path="images/flexi-capture/fls/int_down.gif" /> ボタンを使うと、領域を対応する方向に移動できます。区間を表示領域に収めるには、<img src="https://mintcdn.com/abbyy/lqYknuOmCa79141v/images/flexi-capture/fls/int_fit.gif?fit=max&auto=format&n=lqYknuOmCa79141v&q=85&s=3cfc94c6c48425e3d3af75c3813cee39" alt="区間を表示領域に収めるボタン" style={{display:"inline-block",verticalAlign:"middle",margin:0}} width="22" height="21" data-path="images/flexi-capture/fls/int_fit.gif" /> をクリックします。

<div id="specify-the-interval">
  ## 区間を指定する
</div>

グラフの下にあるfieldには、区間の数値が表示されます。区間は、マウスでグラフを編集して指定することも、対応するfieldに数値を入力して指定することもできます。

ビジュアルあいまい区間エディタには、2 つのモードがあります。

* **Distance** – 小数を含めることができる単位のファジー区間。**Interval type** で **Distance** を選択します。
* **Integer** – 文字数で表す string の長さなど、正の整数のファジー区間。**Interval type** で **Integer** を選択します。

<Note>
  **Character String** 要素の **Properties** ダイアログからあいまい区間エディタを開くと、エディタを呼び出した field に応じて、2 つのモードのいずれかが自動的に選択されます。
</Note>

<div id="edit-the-graph">
  ### グラフの編集
</div>

マウスで緑色のマーカーを左右に動かすことで、区間を変更できます。傾きの角度を変更することもできます。なお、いくつかの制限があります。たとえば、左のマーカーを右のマーカーより右へ移動することはできません。対応する数値は、グラフの下のfieldに表示されます。

<div id="change-the-numerical-values-directly">
  ### 数値を直接変更する
</div>

これらのフィールドは、プログラムにおけるファジー区間の表現に対応しています。

| Field                            | 説明                                                         |
| -------------------------------- | ---------------------------------------------------------- |
| **Left**                         | 区間の左極値点です。                                                 |
| **Left non-penalized**           | 左側の非減点点です。                                                 |
| **Right**                        | 区間の右極値点です。                                                 |
| **Right non-penalized**          | 右側の非減点点です。                                                 |
| **Left slope** / **Right slope** | グラフの左右の傾きを設定します。これは、非減点点から **Distance** だけずれた場合の減点係数を表します。 |

傾きを変更すると、非減点点は変わらず、対応する極値点が移動します。極値点または非減点点を変更すると、対応する傾きが変わります。いずれかのフィールドを編集すると、それに応じてグラフと関連するフィールドの値が更新されます。

<div id="save-the-results">
  ## 結果の保存
</div>

あいまい区間エディタが **Character String** 要素の **Properties** ダイアログから呼び出された場合、**OK** をクリックすると、ファジー区間はダイアログ内の対応する field に自動的に挿入されます。

あいまい区間エディタが **Tools** メニューから呼び出された場合は、**Result** field または **Code** field からファジー区間をコピーできます。**Code** field は、たとえばファジー区間を **FuzzyQuality** function の引数として使用する際に、そのコードを **Advanced** タブに貼り付けることができます。

詳細については、[Nearest と FuzzyQuality で要素を検索する](/ja/flexi-capture/fls/tips-tricks/date9)を参照してください。
