
How a histogram is created
FlexiLayout Studio projects all objects of a certain type detected in the search area onto the horizontal or vertical axis. The projection is the sum of the objects’ widths or heights, and the linear size of each object of the given type is added to the projection. When looking for a horizontal gap, FlexiLayout Studio creates a projection on the vertical axis. When looking for a vertical gap, it creates a projection on the horizontal axis. For example, to find a vertical White Gap among the text objects, FlexiLayout Studio sums up the heights of all text objects that are located in the search area above a particular point on the horizontal axis and that intersect the search area of the element. FlexiLayout Studio then looks for regions where the height of the histogram is less than a particular value. These regions correspond to areas in which the number of objects is relatively small and their projection is less than a certain predefined value. A certain number of objects must be allowed in the White Gap because real images often contain speckles and other noise introduced during scanning. This noise must be ignored when looking for gaps between columns or paragraphs, and it does not significantly affect the overall profile. Suppose there are text objects H1, H2,…, H9 in the search area. In the following figure, these objects are highlighted in black. The search area also contains other types of objects (highlighted in red).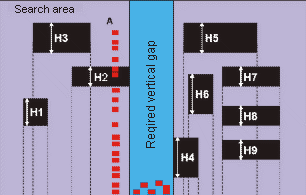
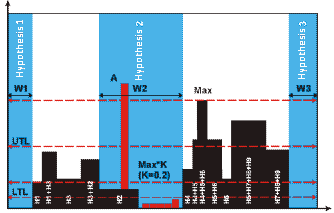
K=0.2). The result is the maximum allowed level of the White Gap (marked as White Gap threshold in the figure). If the resulting White Gap threshold > 0, other objects may be present in the area of the White Gap.
Once the White Gap threshold has been calculated, it is compared with the values set in Lower threshold limit and Upper threshold limit. If White Gap threshold < Lower threshold limit, the White Gap threshold is assigned the value of the Lower threshold limit, and this value is used to look for the White Gap. If White Gap threshold > Upper threshold limit, the White Gap threshold is assigned the value of the Upper threshold limit.
Next, the heights on the histogram are compared with the White Gap threshold to find areas where the level of the histogram is less than the White Gap threshold.
The Min width/height property sets the minimum absolute width of the White Gap. If the value is W2, the two other hypotheses are discarded.
A White Gap hypothesis has the following properties: